Status of the Semiconductor Industry and Supply Chain: Q1–Q2 2025
The first half of 2025 has brought signs of stabilization in the global semiconductor market, with recovery signals emerging from selected consumer and infrastructure segments. However, the broader industrial recovery remains muted, and growth is increasingly concentrated in high-performance nodes tied to AI and premium-end markets rather than across-the-board demand. According to the latest data, the rebound is nuanced—some verticals have resumed shipment growth, while others remain sluggish or in inventory correction.
Sales and Regional Performance: China and AI Infrastructure Fuel the Recovery
According to the Semiconductor Industry Association (SIA), global chip sales reached $57 billion in April 2025, marking an increase of 22.7% year-on-year and 2.5% month-on-month. This was the first monthly increase in 2025 and the 18th consecutive month of year-over-year growth. China showed the strongest monthly rebound at +5.5%, followed closely by Asia-Pacific (+5.3%). The Americas led in year-over-year growth at 44.4%, although April saw a slight MoM contraction (-1.1%). Europe and Japan were essentially flat, with modest single-digit gains.
This geographic divergence reflects both structural demand differences and policy responses. China's AI and server expansion continues to outpace expectations, while U.S. and European demand is being driven more by data center refresh cycles and selective investment in advanced logic.
Chart Analysis: Growth Driven by High-End, Not Volume
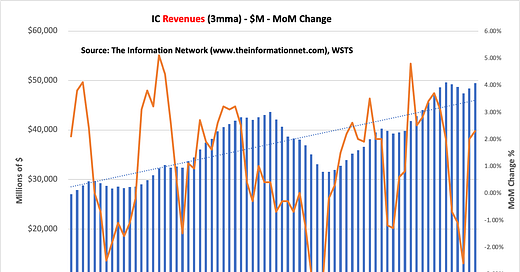
According to Chart 1, integrated circuit revenues (3-month moving average) show a solid recovery trajectory since the downturn in early 2023, climbing toward the $50 billion mark. However, the accompanying orange line (MoM % change) reveals persistent volatility, suggesting uneven month-to-month momentum despite the overall uptrend.


